Interactions
1. MFPI – Interaction with a continuous variable in a RCT
In a recent paper we have argued that data-dependent modelling should play a more prominent role in clinical trials (S&R (2007): Modelling to extract more information from clinical trials data: on some roles for the bootstrap). Given the enormous amount of resources spent on conducting a large clinical trial, it is surprising that greater efforts are not made to try to extract more information from clinical trials data.
1.1 Motivating example
- An MRC trial comparing best supportive treatment (MPA) with interferon clearly showed an overall benefit of interferon:
P < 0.01; HR = 0.75; 95% CI (0.60, 0.93)
|
|
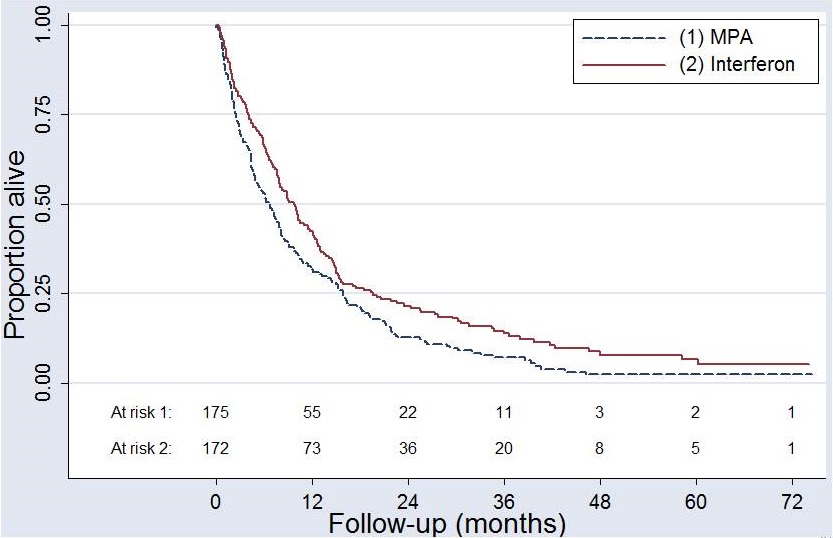
- However, is the treatment effect similar in all patients?
- There were ten possible covariates available for the investigation of treament-covariate interactions – only one is significant – white cell count (WCC; p < 0.01).
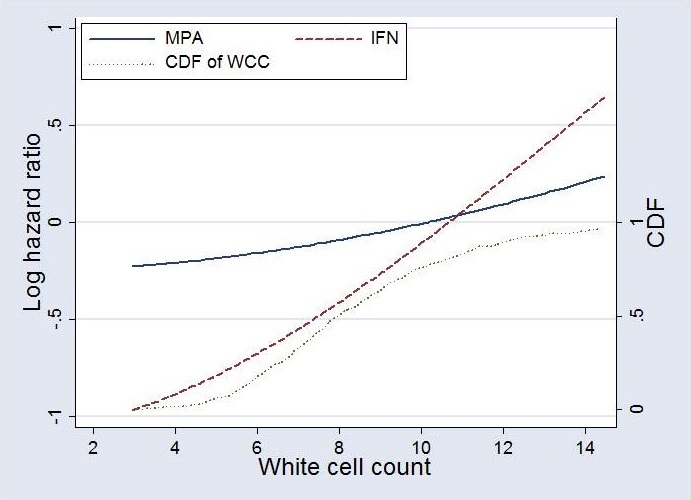
- Prognostic effects of WCC in the two treatment groups (left)
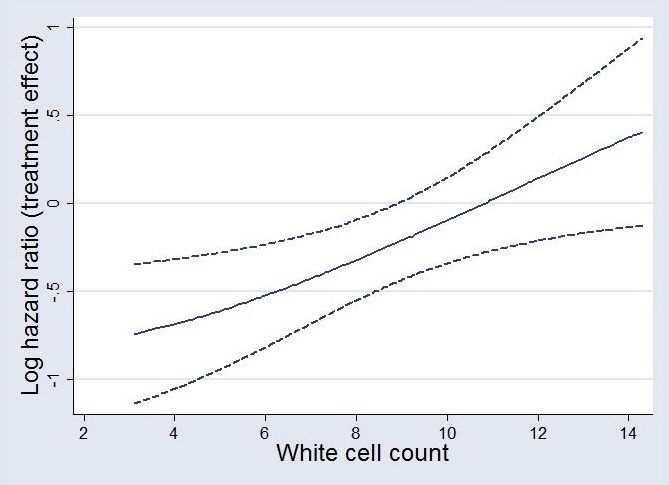
- The difference estimates the dependence of the treatment effect (treatment effect function; TEF) on WCC (right)
 |
 |
- In the absence of an interaction, the two WCC curves would be (roughly) parallel;
if there were no prognostic effect of WCC, they would be parallel to the x-axis - Here, they are not parallel – they actually cross at WCC about 10 and the test for interaction is significant
- Does this treatment effect function agree with the data?
- Check in 4 subgroups of about equal sizes
|
|
|
Estimated hazard ratios (HR: Interferon to MPA) |
|
| overall: 0.75 (0.60 – 0.93) | |
| In subgroups defined by the value of WCC: | |
| I: 0.53 (0.34 – 0.83) | II: 0.69 (0.44 – 1.07) |
| III: 0.89 (0.57 – 1.37) | IV: 1.32 (0.85 – 2.05) |
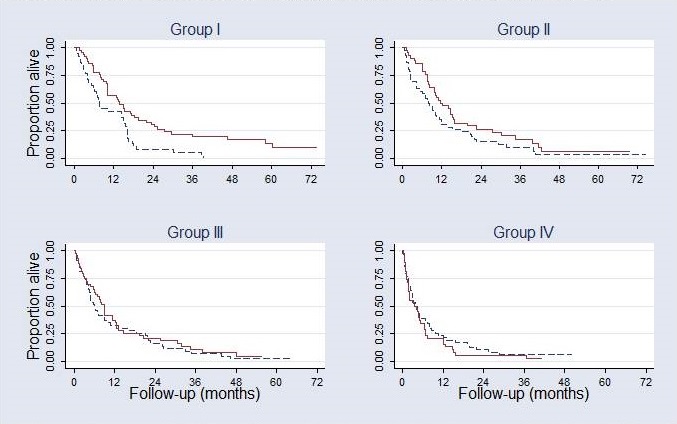
There is a large effect favouring IFN in group I (low WCC values). The advantage disappears for patients with higher WCC values. Analyses in subgroups support the estimated treatment effect function.
Concerning interpretation:
We have searched for markers with an influence on the effect of treatment. This is hypothesis generation, needing validation in new data.
For hypothesis generation we recommend using small p-values (eg. 0.01)
- R&S (2004): A new approach to modelling interactions between treatment and continuous covariates in clinical trials by using fractional polynomials
- Royston et al (2004): Is treatment with interferon-alpha effective in all patients with metastatic renal carcinoma? A new approach to the investigations of interactions
1.2 The standard approach to analysis of interactions is based on cutpoints
In an RCT, many variables, some continuous, are collected and are often used to investigate whether any of them modifies the treatment effect. Usually, continuous variables are split into two groups (i.e. dichotomized) at some suitable cutpoint such as the median or a pre-defined cutpoint from the literature. Unfortunately, dichotomization is still the ‘standard’, despite the fact that major weaknesses of this practice have been recognized for several decades and have been emphasized in many papers in the context of investigating ‘main’ effects of continuous variables in a regression model (Altman et al (1994): Dangers of using Optimal cutpoints in the evaluation of prognostic factors; Royston et al (2006): Dichotomizing continuous predictors in multiple regression: a bad idea). Most of these problems recur in investigations of interactions (7.7 Categorization).
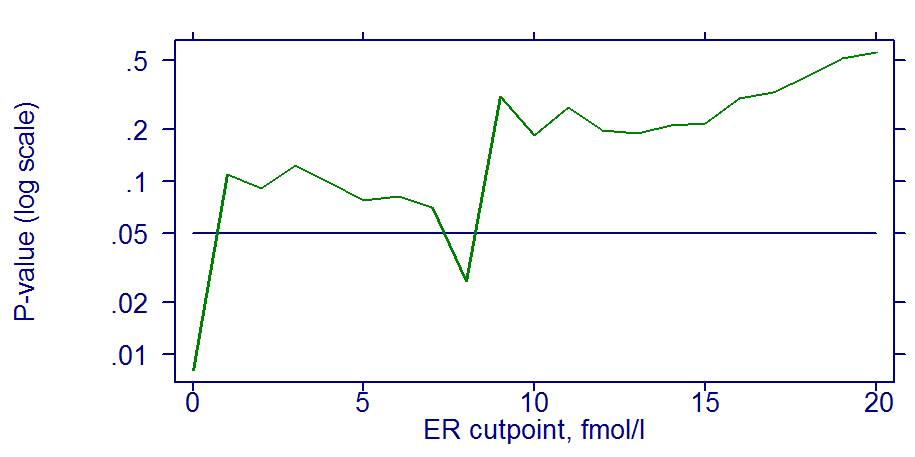
For illustration we will use data from a randomized trial of the German Breast Cancer Study Group (GBSG; see also XY). We will investigate whether the continuous variable estrogen receptor value (ER; in fmol) has an influence on the effect of hormonal treatment. The standard approach requires to dichotomize ER. However, which cutpoint? In the literature several cut points in the range from 0 – 20 were used. In the plot we investigate all possible in this range. The plot shows p-values from a test for interaction. Using a cutpoint 0 (0 versus 1 and larger) indicates a significant p-value at the 0.01 level. However, already the cutpoint 1 would indicate a non-significant result. The p-value of the test for interaction depends strongly on the cutpoint chosen.
1.3 The MFPI approach
There are much better alternatives available (R&S (2004): A new approach to modelling interactions between treatment and continuous covariates in clinical trials by using fractional polynomials). The key ideas of the MFPI approach are briefly discussed below (R&S (2008): Interactions between treatment and continuous covariates – a step towards individualizing therapy (Editorial)).
First, MFPI estimates for each treatment group a fractional polynomial function representing the prognostic effect of the continuous covariate of interest, optionally adjusting for other covariates. Second, the difference between the functions for the treatment groups is calculated and tested for significance. The testing is done through an analysis of interaction between treatment and the FP function. A plot of the difference (e.g., log hazard ratio) against the covariate, together with a 95% CI, is termed a ‘treatment-effect plot.’ A treatment-effect plot for a continuous covariate not interacting with treatment would be a straight line parallel to the x-axis, whereas a treatment-covariate interaction would be indicated by a non-constant line, often increasing or decreasing. For more details see 7.3 General Considerations and 7.4 The MFPI Procedure. Examples are presented (7.5 Example 1: Advanced Prostate Cancer; 7.6 Example 2: GBSG Breast Cancer Study). Regarding selection of the specific functions we originally suggested four approaches with varying flexibility (R&S (2009): Two techniques for investigating interactions between treatment and continuous covariates in clinical trials).
For an example published in the medical literature see Royston et al (2004): Is treatment with interferon-alpha effective in all patients with metastatic renal carcinoma? A new approach to the investigations of interactions.
For an example providing more methodological background and a comparison to STEPP (Subpopulation Treatment Effect Pattern Plot; Bonetti & Gelber (2000)) see Sauerbrei et al (2007): Detecting an interaction between treatment and a continuous covariate: a comparison of two approaches. See also 7.8 STEPP; 7.9 Example 3: Comparison of STEPP with MFPI.
1.4 Comparison of MFPI to several alternatives
In a recent simulation study we were able to illustrate striking advantages of MFPI over methods based on dichotomization or categorization (R&S (2013): Interaction of treatment with a continuous variable: simulation study of significance level for several methods of analysis; R&S (2014): Interaction of treatment with a continuous variable: simulation study of power for several methods of analysis). Based on the these results we changed our recommendation for the most suitable approach as follows: ‘If subject-matter knowledge gives good arguments for a non-monotone treatment effect function, we propose to use a second-degree fractional polynomial approach, but otherwise a first-degree fractional polynomial (FP1) function with added flexibility (FLEX3) is the method of choice.’
1.5 Averaging several treatment effect functions
If IPD (individual patient data) from several RCTs are available differential treatment effects of continuous variables can be investigated by deriving treatment effect functions (TEF) in each study and averaging them across studies using our approach for meta-analysis (S&R (2011): A new strategy for meta-analysis of continuous covariates in observational studies).
For a paper describing the protocol of such a study see Kasenda et al (2014): Investigation of continuous effect modifiers in a meta-analysis on higher versus lower PEEP in patients requiring mechanical ventilation – protocol of the ICEM study. For the medical results see Kasenda et al (2016): Multivariable fractional polynomial interaction to investigate continuous effect modifiers in a meta-analysis on higher versus lower PEEP for patients with ARDS. Using data from eight randomized controlled trials in breast cancer, S&R (2022: Investigating treatment-effect modification by a continuous covariate in IPD meta-analysis: an approach using fractional polynomials, illustrate several methodological issues to average TEF functions. To improve reporting of available data and all steps of the analysis we introduce a three-part profile called MethProf-MA.
See also Meta-Analysis.
2. MFPT – Modelling of time-dependent effects in survival data
In a Cox proportional hazards model, the effect (log relative hazard) of a covariate is assumed to be independent of time. Standard methods may be used to check whether the effect of one or more variables is time-dependent, meaning that the important assumption of proportional hazards (PH) is (possibly seriously) violated (11.1 Time-Varying Hazard Ratios in the Cox Model). A bit of notation: as from 2011 (Royston & Lambert), we distinguish between a time-dependent covariate effect, meaning that the regression coefficient for a variable changes over time (thus inducing non-proportional hazards), and a time-varying covariate, meaning that the covariate itself is observed repeatedly over time – sometimes known as ‘updating’.
The MFPT proposal combines three stages. In stage 1 it selects an MFP model under the assumption of PH in the full-time period. In stage 2 it investigates whether a variable with a short-term effect should be added (still PH assumption, but restricted time-period) . In stage 3 it checks whether the effects of selected variables and functions vary over time (FPT procedure, Sauerbrei et al (2007): A new proposal for multivariable modelling of time-varying effects in survival data based on fractional polynomial time-transformation).
For more details about FPT and a comparison to some other approaches see Buchholz & S (2011): Comparison of procedures to assess non-linear and time- varying effects in multivariable models for survival data. Properties of the FPT procedure have been investigated in a thesis (Buchholz (2010): Assessment of Time-Varying Long-Term Effects of Therapies and Prognostic Factors). A paper is in preparation.
A measure to assess time-varying effects has been proposed (Buchholz et al (2014): A Measure for Assessing Functions of Time-Varying Effects in Survival Analysis).